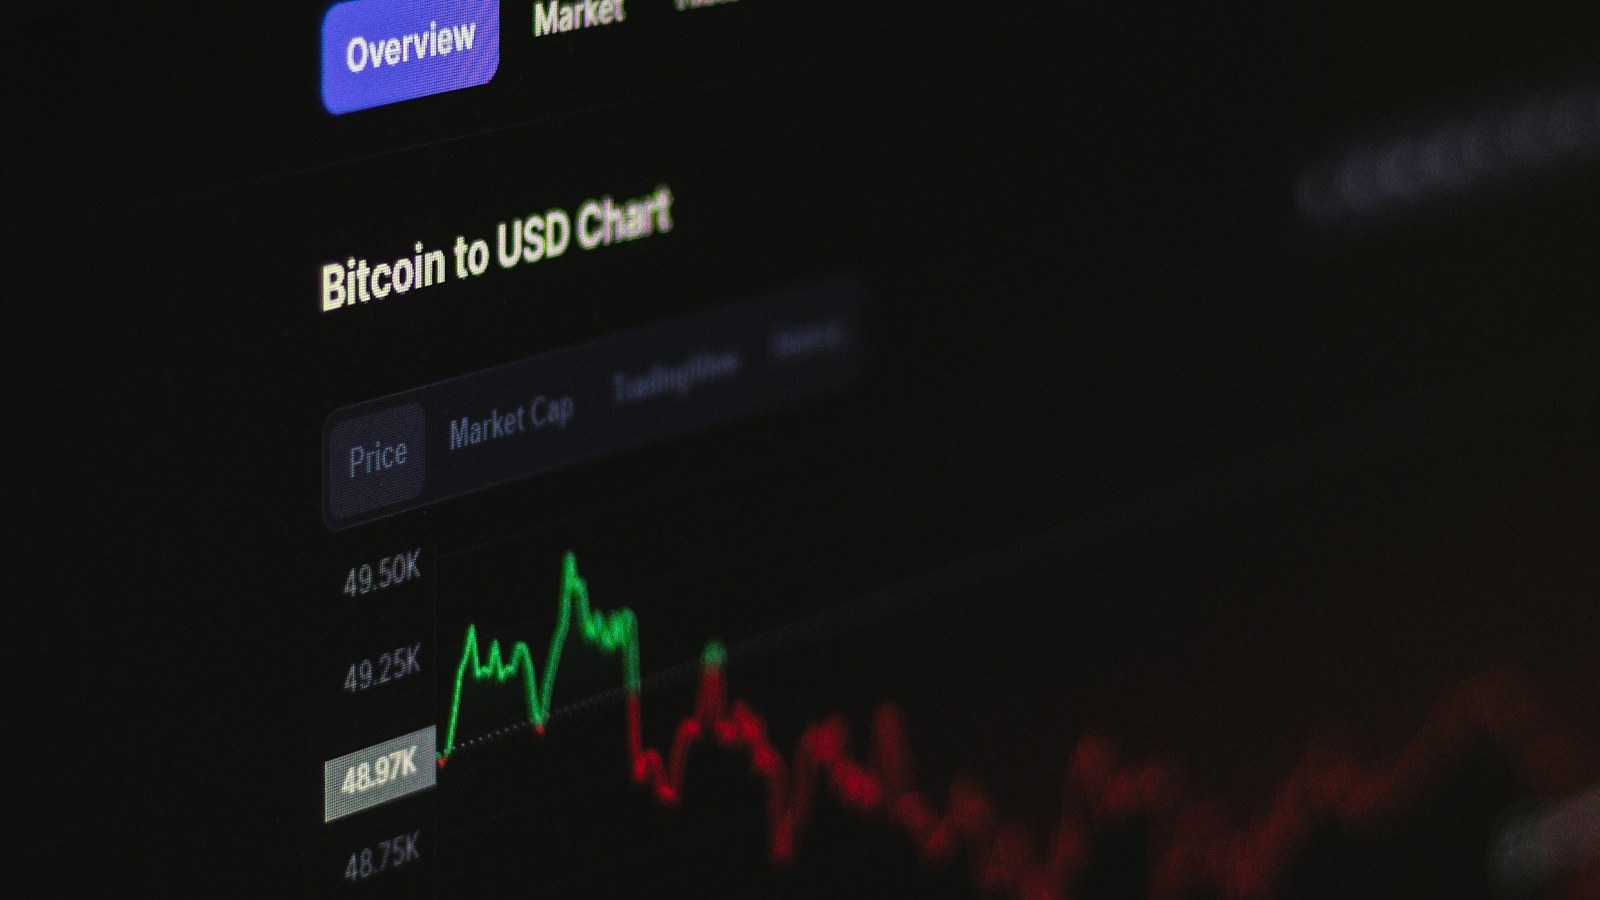
A year ago today, on October 6, 2025, bitcoin traded as high as $126,272 on Bitstamp, one of the longest-running crypto exchanges. As we write this on the anniversary, it's sitting around $85,500. That's a loss of about 32%, which would be a rough year for almost any other asset. For bitcoin, it's the gentlest first year after a cycle top on record.
We wanted to check that claim ourselves rather than take it from a headline, so we pulled Bitstamp's full daily price history back to 2013 and lined up all four cycle peaks the same way: the intraday high on the day of the peak, the closing price exactly one year later, and the deepest low in between. Using one exchange's data for every cycle keeps the comparison apples to apples, though other indexes (CoinGecko lists today's record as $126,080) will differ by a few hundred dollars.
Four cycle peaks, one year later
| Cycle peak (Bitstamp high) | Price one year later | Change after one year | Deepest low within that year |
|---|---|---|---|
| Nov 30, 2013: $1,163 | $377 | -67.6% | $275 (-76.4%) |
| Dec 17, 2017: $19,666 | $3,497 | -82.2% | $3,122 (-84.1%) |
| Nov 10, 2021: $69,000 | $17,551 | -74.6% | $15,632 (-77.3%) |
| Oct 6, 2025: $126,272 | about $85,500 (Oct 6, 2026, intraday) | -32.3% | $57,735 on Jul 1, 2026 (-54.3%) |
The three earlier cycles fell an average of 74.8% in their first year. If bitcoin had tracked that average this time, it would be trading near $31,800 today instead of the mid-$80,000s. Even the worst moment of this cycle, the dip to $57,735 on the first day of July, was shallower than where every previous cycle was sitting at its one-year mark.
That said, "shallow" is relative, and it's worth keeping the dollars in view. Someone who put $10,000 in at the peak was down to roughly $4,570 at the July low and is at about $6,770 now. They would need a 48% gain from here just to get back to even. The previous three cycles took between roughly two and a third and three and a quarter years to reclaim their old highs on Bitstamp (February 2017, November 2020 and March 2024), so if this one is faster, it will be breaking that pattern too.
How the year actually unfolded
The month-end closing prices tell most of the story, with a few events that moved them. Here's the year as we pieced it together from the price data and reporting at the time:
| Month | Bitstamp close | What was going on |
|---|---|---|
| Oct 2025 | $109,554 | Four days after the peak, on October 10, a tariff scare triggered the biggest one-day liquidation wave in crypto history; bitcoin's daily low hit $109,683. |
| Nov 2025 | $90,382 | The slide continued through November. |
| Dec 2025 | $87,496 | Bitcoin ended the year roughly 30% under its record. |
| Jan 2026 | $78,635 | First monthly close below $80,000 of the cycle. |
| Feb 2026 | $66,985 | A sharp drop, followed by a rebound that held for a few months. |
| Apr 2026 | $76,310 | The best close of the spring. |
| Jun 2026 | $58,526 | Spot bitcoin ETFs saw a record $4.06 billion in monthly outflows, Strategy authorized a program that could sell more than $1 billion of its bitcoin, and the dollar strengthened. |
| Aug 2026 | $78,571 | A larger Treasury bond buyback pulled yields down, and bitcoin ran from about $64,000 to $78,500 within days. |
| Sep 2026 | $83,563 | The price climbed back above the ETF crowd's estimated average entry price even after the Fed raised rates at its September meeting. |
June is the month that stands out. Bitcoin had leaned on steady ETF buying for most of the cycle, and when that reversed hard, with Crypto Briefing tallying the worst redemption month since the funds launched, the price had no obvious buyer underneath it. CoinDesk noted at the time that the prospect of Strategy, long the market's most reliable corporate buyer, turning into a possible seller was weighing on an already thin market. The recovery started with something that had nothing to do with crypto at all: a change to the Treasury's buyback program in August that eased long-term yields.
Why this cycle has been milder
The most common explanation is the one the table hints at. In 2014, 2018 and 2022, the marginal buyer and seller was largely retail traders and crypto-native funds, many of them using borrowed money. This time a big slice of the supply sits in spot ETFs, which tend to be held by people who rebalance rather than panic. CoinDesk's anniversary analysis makes the same point and adds that implied volatility is near its lowest level on record.
Those same ETF holders are now the swing factor. Cumulative net inflows into U.S. spot bitcoin ETFs have slipped from about $61.3 billion at the peak to $57.7 billion, according to SoSoValue figures cited by Cointelegraph, and the funds lost about $90 million on Monday alone. Bitfinex analysts, speaking to crypto.news, put the ETF crowd's average purchase price at about $84,320. Bitcoin spent 233 straight days below that level before reclaiming it on September 21, and today's price sits only a little above it.
Our take
This is our opinion, not financial advice. The data supports the idea that bitcoin's cycles have gotten less violent since ETFs arrived, but one mild year isn't proof the old four-year script is dead, and low volatility has a habit of ending abruptly. If you're buying small amounts on a schedule, the past year mostly argues for staying boring and patient. If you trade with leverage, the number to watch is that roughly $84,000 ETF cost basis: a sustained break below it would put a lot of fund holders back underwater, and June showed what happens when they decide to leave at the same time.